


Multi-failure resilience: reconfiguration and recovery
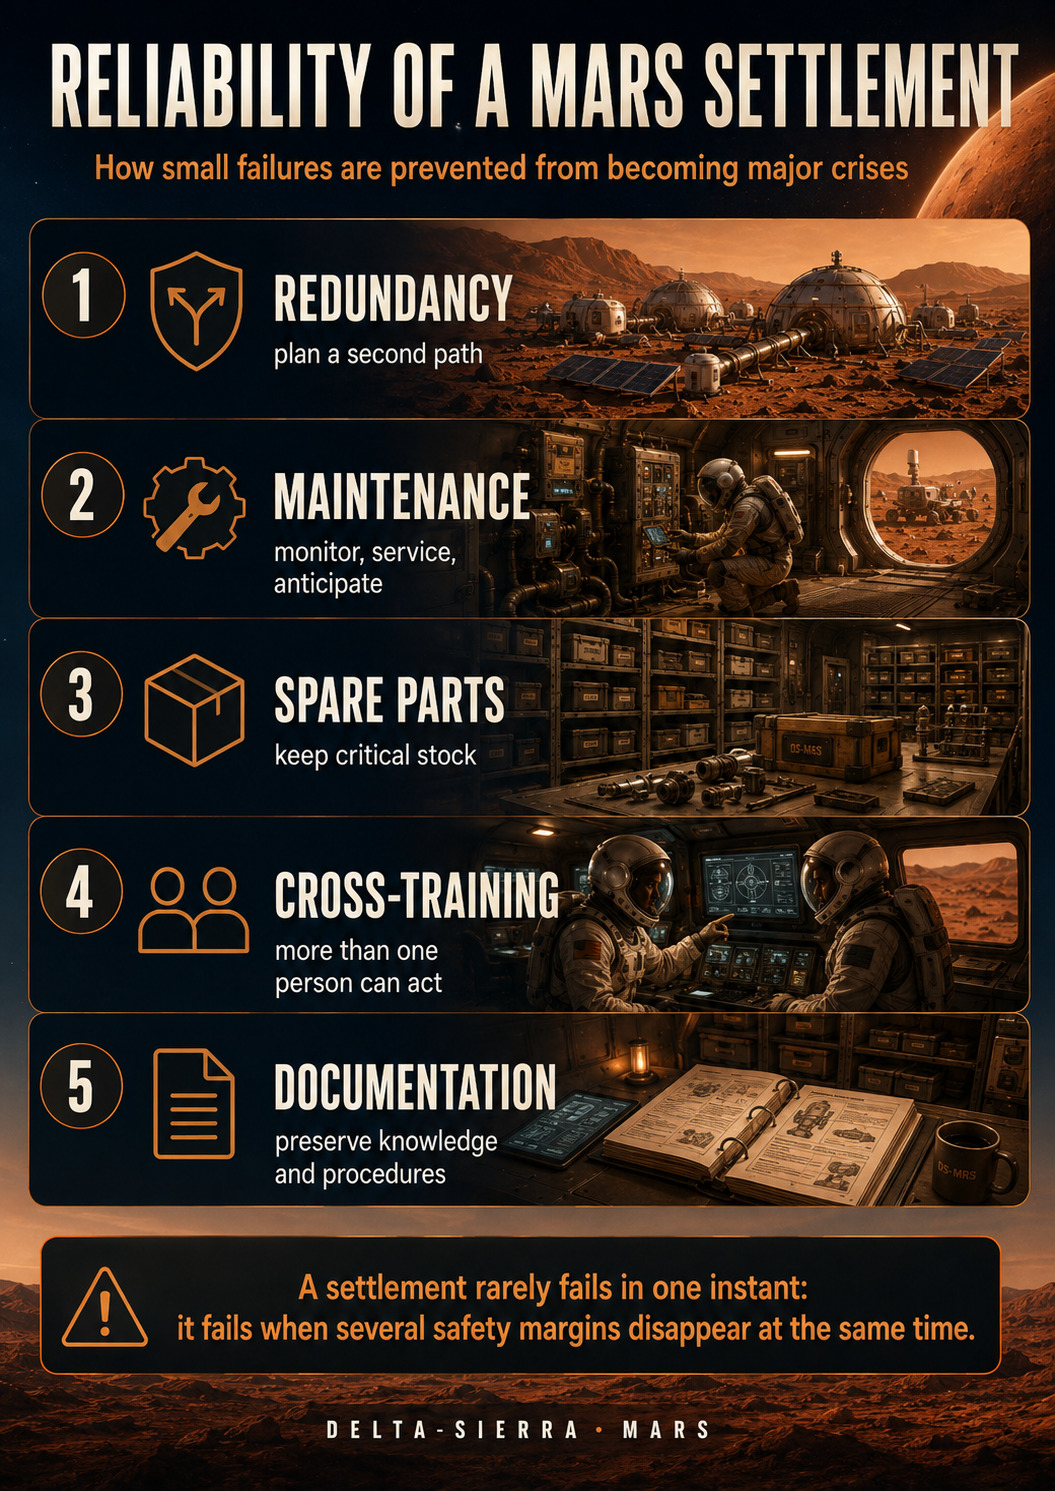
Reason through interacting failures, common causes and cascades, then rebuild safe service step by step.
Mastery objectives
- distinguish independent failure, common cause, cascade and misleading evidence during multi-failure recovery
- preserve minimum safe functions while diagnosis, reconfiguration and repair alter the system state
- use explicit proof gates for function restored, redundancy restored and mission restored
- budget recovery energy, spares, qualified human workload and rollback capability before declaring success
1. The second failure changes the problem
A design may tolerate one failure and become fragile after a second. Two redundant pumps do not protect the function if they share power, cooling or software. Resilience therefore begins with common-dependency mapping and the ability to keep a minimum function alive when the nominal configuration is unavailable.
2. Common causes
Common causes include fire, flooding, contamination, software defects, bad part batches, surges and human error. They can disable several redundant channels at once. Physical separation, technology diversity, version diversity and distributed stocks reduce risk, but each has a cost that should be tied to function criticality.
3. Cascades across systems
A power failure can stop pumps and cooling; rising temperature can then damage batteries or electronics; communications loss makes diagnosis harder. A cascade is a causal chain, not a list of independent failures. Procedures should detect early signals and shed selected loads before propagation removes recovery options.

4. Minimum safe configuration
During a crisis the objective is not immediate restoration of the full settlement. First establish a stable state: refuge volume, controlled atmosphere, minimum water, critical power, communications and medical capability. Industrial and scientific functions remain off until reserves and power margin support their return.
5. Reconfiguration
Reconfiguration uses planned alternate paths: switching a bus, connecting a spare pump, isolating a compartment, moving crew or transferring a load to another controller. These actions should be tested before the emergency. An untested emergency connection may prove inaccessible or incompatible when it is most needed.
6. Diagnosis under uncertainty
After multiple failures, some sensors may also be wrong. Diagnosis cross-checks independent measurements, local observation and system behavior. Teams avoid changing many variables simultaneously because that destroys causal information. When time allows, restore observability first and change one thing at a time.
7. Recovery resources
Repair consumes power, people, tools, spares, time and sometimes a safe atmosphere. Resilience planning reserves these resources. Using every available battery watt to maintain a nonessential load can eliminate the ability to restart a critical pump hours later.
8. Progressive return to normal
After the fault is controlled, loads return in stages. Each stage has a stability criterion. Voltage, temperature, pressure, flow and consumption are monitored before the next function is added. Restarting too quickly can recreate the cascade or drain reserves just after the first recovery.
Deepening: beyond N+1
N+1 protects against loss of one element, not necessarily a zone failure or shared-resource failure. Exercises should include combinations such as one generator lost, cooling limited and one technician unavailable. The goal is to reveal dependencies that simple redundancy counts miss.
Deepening: configuration debt after crisis
Emergency workarounds leave an unusual configuration: temporary cables, disabled protections, borrowed spares. That debt must be inventoried and removed. Otherwise the settlement may look nominal while silently operating with fewer barriers than before.
9. Worked example: recovery power
The refuge requires 22 kW and post-failure generation is limited to 35 kW, leaving 13 kW for recovery. A restart pump needs 9 kW for three hours, leaving only 4 kW for other temporary loads. Starting an 8 kW workshop simultaneously would exceed available power. Recovery therefore needs an explicit power sequence.
Calculated case study: how long can a battery bridge a critical power deficit?
TEACHING ASSUMPTION — Critical load is 42 kW. After a multi-failure event, the surviving generator provides 30 kW. The battery has 18 kWh nominal energy, but 20% must remain in reserve.
Let P_c be critical load and P_g available generation in kW; ΔP the deficit in kW; E_n nominal energy in kWh; r reserve, dimensionless; E_u usable energy; and t bridging time.
ΔP = P_c − P_g = 42 − 30 = 12 kW. E_u = 18 × (1 − 0.20) = 14.4 kWh. t = E_u ÷ ΔP = 14.4 ÷ 12 = 1.2 h = 72 min.
The battery does not “solve” the multi-failure event: in this simplified scenario it buys 72 minutes to shed load, reconfigure, repair or reach a minimum safe configuration.
10. Exercise
A settlement loses one of two main power converters and then detects a water-loop leak. Define the first three actions, the minimum safe configuration and the order in which noncritical services should return.
11. Reasoned solution
First stop the cascade: stabilize power, isolate the leak, preserve water and refuge capability, then verify measurements. Industrial loads remain off. Once reserves and loop status are known, services return by criticality with margin checks. A common-cause diagnosis should precede restart of the second channel if the same cause could damage it.
12. Mini-project
Build a six-hour multi-failure exercise involving power, ECLSS, mobility and communications. Define injected events, available information, expected decisions, success criteria and the data required for debriefing.
Multi-failure resilience: preserve functions, not appearances
A settlement can look operational while silently losing resilience. One power converter may be bypassed, one water loop isolated and the only rescue rover assigned to routine logistics. Each condition alone may be acceptable, but their combination can create a system that has no margin left for the next failure. Multi-failure resilience therefore begins by tracking functions and dependencies rather than counting how many pieces of hardware are still running.
The first failure changes configuration. The second failure acts on that new configuration, not on the original design. This is why a simple N+1 redundancy statement is not enough. Common-cause failures, shared utilities, maintenance states and human workload can remove several nominally independent channels at once.
Primary failure, secondary effects and cascades
A primary failure is the initiating event chosen for analysis. Secondary effects are consequences created by that event, such as loss of cooling after loss of power. A cascade occurs when those consequences create additional failures or resource losses. The labels are contextual: what is secondary in one scenario can be primary in another.
For example, a power bus fault can stop a coolant pump. Rising temperature can force a computer cluster offline. Loss of computing can degrade autonomous control and increase crew workload. Crew attention then shifts away from another developing anomaly. The chain crosses electrical, thermal, software and human systems even though the initiating fault was electrical.
Resilience analysis should therefore use dependency maps that include resources and people. Electricity, cooling, data, atmosphere, water, communications, access, tools, software and qualified technicians can all be dependencies.
Critical functions and minimum safe configuration
The settlement should define the minimum functions required to keep people alive and preserve a recoverable system state. This minimum safe configuration is not the same as normal operation. It may support refuge atmosphere, minimum thermal control, emergency communications, essential medical capability, water access and enough power to diagnose and repair the fault while suspending science and industrial production.
Each function should have a measurable capacity and a survival horizon. “Water is available” is less useful than “the protected potable reserve supports the current refuge population for X days under the declared conservation mode.” This turns resilience into a time-dependent budget.
Minimum safe configuration must also account for access. A redundant pump in a compartment that cannot be entered after a fire is not available. A spare controller that requires a programming tool stored in the failed zone is likewise not independent.
Common-cause failure defeats simple redundancy
Two identical channels can share the same design defect, software bug, contaminated feed, cooling loop or maintenance error. Redundancy improves resilience only to the extent that failure causes are independent. Analysis should explicitly ask what can defeat all redundant channels at once.
Diversity can reduce common-cause risk. Different power sources, separate physical routing, independent sensors or different control modes may fail differently. Diversity also adds complexity, training burden and spares, so it should be applied where consequence justifies it rather than everywhere.
Physical separation is another form of independence. Two batteries placed side by side may both be lost to one fire. Two data stores on the same power bus may both disappear during a bus fault. Architecture diagrams should therefore show shared zones and utilities, not just logical connections.
Sensor trust and diagnosis under uncertainty
During a multi-failure event, sensors may disagree because the process is genuinely changing, because one sensor failed or because the data path is corrupted. The team should not “vote” blindly unless sensor independence and failure modes justify voting. Instead, diagnosis uses trends, cross-parameter consistency, independent instruments and physical expectations.
Confidence can be represented qualitatively. A measurement may be confirmed, probable, suspect or unavailable. The decision log should preserve this status. When uncertainty is high, the settlement may choose a conservative degraded mode while collecting better evidence.
Automation should expose why it believes a failure exists. A fault-detection system that only displays a red icon can create dependence on software without supporting human diagnosis. Useful displays show the triggering measurements, violated limits, time history and the actions already taken automatically.
Load prioritization and graceful degradation
Graceful degradation means reducing capability in a controlled way instead of failing abruptly. Industrial processes can pause, scientific instruments can power down, nonessential lighting can reduce and some crop lighting can shift in time while life-support and refuge loads remain protected. The exact priorities depend on system state and how long the degraded condition lasts.
The plan should avoid using all reserves immediately. Battery energy, oxygen stores, water, spare filters and crew attention are recovery resources. Consuming them too quickly may simplify the first hour but make the tenth hour impossible.
Load shedding should therefore include restoration criteria. A load is not simply “off”; it has a condition for safe restart, an estimated resource cost and a consequence of continued shutdown.
Reconfiguration is an engineering action with configuration debt
Reconfiguration can route power around a failed bus, cross-connect a water loop, move crew into refuge, assign a cargo rover to rescue duty or switch control to a local manual mode. Every reconfiguration changes assumptions elsewhere. The new state needs to be recorded as carefully as a hardware modification.
Temporary configurations create configuration debt. They may disable protections, consume a spare, leave unusual software settings or reduce redundancy. The recovery plan should list each temporary change and assign an owner for restoring or formalizing it.
A settlement should resist “normalizing deviance,” where a temporary degraded state becomes routine because nothing bad happened immediately. Repeated acceptance of reduced barriers silently shifts risk until another fault reveals the missing margin.
Progressive recovery: prove stability before adding load
Return to service should occur in stages. After repairing the initiating fault, the team verifies the minimum safe configuration first. Then one additional function is restored, relevant parameters are observed for a defined stability period, and only then does the next function return. This prevents a rapid restart from recreating the cascade.
Stability criteria can include voltage, pressure, temperature, flow, atmosphere composition, error rate or resource trend. The criterion should match the function being restored. A generic “no alarms for five minutes” can miss slow thermal or contamination processes.
Recovery ends only when temporary workarounds are reconciled, logs are complete, spares and reserves are re-baselined and unresolved anomalies have owners. A technically running settlement is not yet fully recovered if its documentation and reserves still describe the pre-event configuration.
Reliability and maintainability metrics
Availability from MTBF and MTTR
A = MTBF / (MTBF + MTTR)
MTBF is mean time between failures and MTTR is mean time to repair. If MTBF is 900 hours and MTTR is 30 hours, the simplified inherent availability is 900/(900+30) ≈ 0.9677, or 96.8%. This does not include logistics delays, waiting for a spare or crew scheduling unless those are incorporated into the repair time definition.
Series-function availability
A_series ≈ A_1 × A_2 × … × A_n
For independent components required simultaneously, the simplified series availability is the product of individual availabilities. If two essential components each have 0.98 availability, combined availability is approximately 0.9604. Independence is an assumption that must be challenged in real architecture.
Battery bridge time
t_bridge = E_usable / ΔP
If usable battery energy is 24 kWh and the deficit between critical load and surviving generation is 8 kW, bridge time is 3 hours. The battery buys time; it does not remove the underlying failure.
Recovery energy as a degraded-power load
If a repair sequence needs a 6 kW pump for 2 hours, a 3 kW heater for 4 hours and 2 kW of diagnostics for 5 hours, energy is 12 + 12 + 10 = 34 kWh. This load must appear in the degraded power budget rather than being treated as free because it is temporary.
Functional margin
M_function = Capacity_available - Capacity_minimum_safe
If available oxygen-production capacity is 4.5 kg/day and minimum safe requirement is 3.8 kg/day, margin is 0.7 kg/day. A positive margin can still be fragile if uncertainty or maintenance could remove it; the number is a starting point for decision-making.
Integrated scenario: power loss followed by ECLSS degradation
A power fault removes one generation channel and forces industrial loads offline. Thirty minutes later, carbon-dioxide removal begins to underperform because one circulation fan is on the affected bus. The second event is not independent; it is a consequence of the changed power configuration.
The team establishes the minimum safe configuration, verifies refuge atmosphere capability and computes how much power remains after essential loads. It then asks whether restoring the ECLSS fan, switching to a redundant path or moving people to a lower-volume refuge provides the best survival margin. The decision includes thermal effects because concentrating people in refuge increases heat and humidity loads.
Earth receives a structured update, but local action proceeds inside the delegated emergency envelope. The recovery team also protects enough battery energy for restart rather than spending the full reserve on comfort loads during stabilization.
Integrated scenario: rover immobilized with intermittent communications
A crew rover stops 14 km from the settlement while the communication link drops in and out. The mobility failure becomes a communications, life-support and rescue problem. The first goal is not to repair the rover; it is to establish crew survival time, location confidence and rescue options.
The base confirms which rescue vehicle is mission-ready, how much energy and life-support margin it has, and whether route conditions have changed. The stranded crew reduces nonessential loads and transmits compact status packets whenever the link is available. If an intermediate shelter exists, the decision may involve moving only if doing so increases survival margin rather than simply reducing distance.
The scenario demonstrates why a rescue rover assigned to routine cargo work is not truly available. Fleet availability must be calculated from mission-ready assets, not total vehicle count.
Integrated scenario: medical incident plus logistics delay
A medical event consumes diagnostic cartridges and sterile supplies faster than planned. At the same time, a cargo delay extends the resupply horizon by four months. The settlement remains clinically capable today but future resilience has decreased.
The medical and logistics teams recalculate usable stock, expiry, alternative diagnostics and consumption forecast. The governance team protects critical inventory from routine use without compromising current care. Earth support updates the future manifest, but local planning assumes the delay may persist.
This is a multi-failure problem because a clinical event and logistics event combine through a shared consumable. Resilience analysis therefore includes inventories, not just hardware.
Integrated scenario: conflicting sensors during a failure
Two water-quality indicators diverge while a recovery loop is already degraded. Switching immediately to the “better” reading may hide contamination; shutting the entire loop may unnecessarily consume reserves. The team classifies each measurement by independence, calibration state and physical consistency with other parameters.
A conservative configuration can isolate the suspect branch while preserving verified storage. The goal is to buy diagnostic time without converting uncertainty into resource loss.
Integrated scenario: repair succeeds but return-to-service test fails
A pump is repaired and starts successfully, yet flow remains unstable during the verification test. Declaring the repair complete would be a governance error. The system stays degraded while the team checks downstream restrictions, sensor validity, control tuning and whether the original diagnosis missed a secondary fault.
The failed test is valuable evidence. Recovery criteria should be written before the restart so schedule pressure cannot redefine “success” after the result is known.
Progressive exercises with solutions
Exercise 1 — Availability
MTBF is 600 h and MTTR is 24 h. Calculate simplified availability.
Solution. 600/(600+24) = 0.9615, or about 96.2%.
Exercise 2 — Battery bridge
Usable energy is 18 kWh and the critical deficit is 6 kW. How long can the battery bridge?
Solution. 18/6 = 3 hours.
Exercise 3 — Recovery energy
A 5 kW pump runs 3 h and 2 kW diagnostics run 4 h. How much recovery energy is required?
Solution. 5×3 + 2×4 = 23 kWh.
Exercise 4 — Common cause
Why are two identical redundant controllers on one power bus not fully independent?
Solution. A single bus failure can remove both controllers, creating a common-cause path.
Exercise 5 — Recovery state
Why should services return in stages after a cascade?
Solution. Staged restoration lets the team prove stability, observe resource effects and avoid recreating the failure by adding too much load too quickly.
Six-hour resilience exercise
Design a training scenario with at least four interacting systems: power, ECLSS, mobility and communications. Begin with one fault, inject a second dependent fault after thirty minutes, then remove one key person from the response team and delay one spare or consumable. Define the information available to the crew at each stage, including at least one contradictory sensor.
The exercise passes if the crew identifies a minimum safe configuration, protects recovery resources, documents reconfiguration, communicates effectively with Earth despite delay, and returns functions in a measured order. The debrief should identify common-cause vulnerabilities and configuration debt created during the event.
Interactive beginner glossary
- primary failure — initiating failure in an analysis.
- failure cascade — propagating sequence of faults and consequences.
- common cause — shared mechanism that removes redundancy.
- minimum safe configuration — essential survivable operating state.
- reconfiguration — deliberate change to the system state.
- configuration debt — unresolved temporary changes.
- MTBF — mean time between failures.
- MTTR — mean time to repair.
Resilience is the ability to preserve functions while the configuration changes
A resilient settlement is not one that never fails. It is one that detects degradation early, preserves the most important functions, prevents cascades, reconfigures around damage and restores service without exhausting the reserves needed for the next problem. This requires architecture, operations and training to be designed together.
Start with minimum safe configuration
For each major emergency family, define the smallest set of functions required to keep people alive and the settlement recoverable. That set may include pressure integrity, atmosphere circulation, fire detection, minimal power, communications, medical support and a refuge. Everything else can then be ranked by time to consequence and contribution to recovery.
The minimum configuration should be physically testable. A paper list saying that a backup exists is not enough. Operators need to know how to switch to it, which dependencies remain common, how much capacity it provides and how long it can be sustained.
Cascades follow dependencies, not organizational charts
A power failure can stop cooling; overheating can disable electronics; loss of communications can slow diagnosis; delayed diagnosis can consume battery reserve; exhausted reserve can remove the restart path. Each arrow in that chain is a dependency. Resilience analysis therefore maps propagation paths rather than reviewing departments independently.
Time-margin chain
M_chain = min(t_limit,i) − t_detect − t_isolate − t_reconfigureThe minimum time to any critical limit controls the chain. In a teaching case, if the earliest limit is 75 min away, detection takes 8 min, isolation 12 min and reconfiguration 20 min, remaining chain margin is 75 − 8 − 12 − 20 = 35 min. The calculation does not guarantee success; it tells the team how much uncertainty and retry time exists before the first critical limit.
Reconfiguration must be observable
After switching buses, pumps, valves or software modes, operators should verify that the intended physical effect occurred. A command acknowledgment is not the same as proof of flow, pressure, voltage or temperature. The recovery checklist should therefore name the measurement that confirms each stage.
Temporary configurations also need explicit ownership. A bypass that solves the immediate fault may reduce protection. A spare installed under emergency conditions may have a shorter inspection interval. An alternate network path may carry less capacity. These differences are configuration debt and should be visible until closed.
Reserve management prevents the second failure
Battery energy, oxygen, clean water, spare filters, crew attention and repair parts are all recovery resources. The team should not consume them all to restore comfort quickly. A staged recovery preserves a protected fraction so that an unsuccessful restart does not leave the settlement with no second attempt.
Diverse redundancy can be stronger than identical redundancy
Two identical units simplify training and spares but may share the same defect or environmental vulnerability. Diverse backup methods can reduce common-cause exposure but increase maintenance complexity and training burden. Resilience design therefore asks where diversity is worth the cost rather than assuming identical or diverse redundancy is always superior.
Cross-training sets a human recovery floor
A settlement can lose technical capability when the only expert is injured, overloaded or isolated. Cross-training should identify tasks that another crew member can safely perform with procedures and remote support, and tasks that cannot be delegated without unacceptable risk. The result is a map of human single points of failure.
Resilience exercise: force two failures to interact
Begin with a power-conversion fault. Add a communications outage fifteen minutes later. Then make one water-quality sensor suspect. The student must define the minimum safe configuration, identify trustworthy evidence, allocate energy reserve, decide which work stops, select a reconfiguration, verify the new state, record temporary conditions and state the criteria for moving from emergency to recovery and from recovery to nominal operation.
The exercise fails if the answer is merely “use the backup.” It passes when the student can show the backup's dependencies, capacity, duration, verification and failure consequences.
Recovery calculation laboratory: protect enough energy to finish the restart
After stabilization, the settlement can fail a second time by spending reserves too quickly. Recovery therefore needs an explicit energy and sequencing budget.
Recovery energy — formula qualification
E_recovery = Σ(P_i × t_i)A 5 kW pump used for 3 h consumes 15 kWh. Diagnostics averaging 2 kW for 4 h consume 8 kWh. Planned recovery energy is 15 + 8 = 23 kWh.
Unit check. kW × h = kWh.
Interpretation. This is an energy budget, not proof the battery can deliver every instantaneous power demand. Peak power, sequencing and distribution constraints remain separate checks.
Reserve fraction after planned recovery
f_remaining = (E_initial − E_recovery) / E_initialIf protected energy begins at 120 kWh and the planned recovery uses 23 kWh, remaining energy is 97 kWh. Fraction remaining = 97/120 = 0.808, about 80.8%. The team should compare this with its protected minimum before authorizing optional restart loads.
Exercise — staged restart
A 40 kWh reserve must support a 6 kW pump for 2 h and 3 kW diagnostics for 4 h. How much energy remains?
Solution. Pump = 12 kWh; diagnostics = 12 kWh; total = 24 kWh; remaining = 16 kWh.

Diagnosis-and-recovery studio: distinguish the failed component from the failed explanation
During a multiple failure, the crew is solving two problems at once. The physical system is changing, and the team’s mental model may also be wrong. A resilience procedure must therefore preserve enough instrumentation and independent evidence to tell whether the proposed diagnosis is actually consistent with what the settlement is doing.
Separate observations from hypotheses
Write raw observations first: bus voltage fell, coolant flow on branch B is low, cabin temperature is rising, pump command is on, breaker state is closed. Then list candidate explanations: failed pump, blocked filter, sensor fault, electrical undervoltage, closed valve, leak. This prevents the first plausible story from becoming “fact” simply because it was stated early.
Evidence consistency score for a teaching fault table
C_h = N_match / N_testedQuestion. How much of the observed evidence agrees with one fault hypothesis?
Example. A candidate “blocked filter” predicts five observable conditions. Four are present and one is absent, so C_h = 4/5 = 0.80. A second hypothesis matches only two of five, C_h = 0.40.
Interpretation. The score helps organize evidence; it is not a probability unless a proper probabilistic model is built. A single highly discriminating observation can matter more than several weak matches.
Limit. The exercise assumes observations are trustworthy. Sensor faults are themselves hypotheses and may invalidate the apparent evidence.
Common-cause failure changes redundancy arithmetic
Two pumps on the same contaminated fluid, two controllers with the same software build or two power converters cooled by one loop can fail together. Resilience analysis should therefore ask which support function can remove several nominally redundant units at once.
Availability of two independent parallel units
A_parallel = 1 − (1−A₁)(1−A₂)If two independent units each have availability 0.95, simultaneous unavailability is 0.05×0.05 = 0.0025 and parallel availability is 0.9975. But if a shared cause can disable both, that simple result overstates resilience. The lesson is not the attractive percentage; it is the need to justify independence.
Recovery is a sequence of proof gates
System recovery means controlled restoration after a fault, not resource recovery from a waste stream. The process should be staged: stabilize the safe configuration, verify the repair, energize the smallest necessary function, observe it long enough to detect recurrence, restore one dependency at a time, and stop if evidence leaves the expected envelope. Each step should have an abort criterion.
Configuration debt accumulates when temporary jumpers, bypasses, load-shed states, substitute parts or procedural waivers are introduced during a crisis. Recovery is incomplete until those temporary states are either removed or formally accepted into the new configuration baseline.
Human workload can become the next common cause
A multi-failure event consumes attention as surely as it consumes power and spares. Treat human workload as a shared resource: list each recurring manual task created by the degraded configuration, the qualification needed, minutes per shift, alarm or inspection frequency, handover burden and the backup person who can take over. Sum the commitments by role rather than by subsystem. If one specialist is required by power, thermal control and communications at the same time, nominal technical redundancy can collapse into a human common cause. Set a saturation threshold before the event, protect sleep and handover, stop non-essential work when the threshold is crossed, and require workload to return below the sustainable limit before declaring recovery complete.
- degraded task and frequency;
- qualified role and named backup;
- minutes per shift and peak simultaneous demand;
- handover or documentation burden;
- trigger for shedding non-essential work;
- criterion for returning the role to sustainable workload.
Recovery proof drill
A repaired power converter passes a bench check, but after reconnection one downstream current sensor reads 18% higher than an independent clamp measurement. The settlement is still on limited battery reserve. Decide whether to restore full load. List the competing hypotheses, the evidence to collect and an abort criterion for the next test.
Reasoned solution
Full restoration is not yet justified because disagreement between measurements creates uncertainty about either load or instrumentation. Candidate explanations include a sensor calibration fault, incorrect measurement location, real transient load, wiring change or converter behaviour. The next step should use the smallest load that discriminates among hypotheses while preserving reserve. An abort criterion can be a current, temperature or voltage threshold coupled to a maximum test duration. Recovery proceeds only when independent evidence converges.
First-Man resilience lab: survive the second failure, not only the first
Resilience is the ability to preserve critical functions while the system is damaged, uncertain and being repaired. Redundancy helps, but two nominally independent units can fail together because they share power, cooling, software, environment, maintenance history or a flawed assumption. The first task after an anomaly is therefore to discover the real dependency structure rather than count how many boxes remain green on a display.
Operators should separate three things that are often mixed: observations, hypotheses and actions. “Pressure fell 12 kPa in five minutes” is an observation. “The isolation valve is leaking” is a hypothesis. “Close branch B” is an action. Writing them separately prevents an early guess from becoming invisible fact and makes it easier to update the diagnosis when new evidence arrives.
Common-cause probability changes the value of redundancy
- Starting question
- How can a simple teaching model show why two redundant units are less protective when part of their failure probability comes from a common cause?
- Read aloud
- Read: “probability of losing the redundant function is approximately the common-cause fraction beta times single-unit failure probability, plus the independent fraction times p squared.”
- Symbols, pronunciation and meaning
- p is a simplified probability that one unit fails over the chosen mission interval; β is the fraction of failure contribution treated as common-cause in this teaching approximation; Ploss is approximate probability of losing the function.
- Units
- All terms are probabilities and therefore dimensionless. They must refer to the same interval and operating assumptions.
- Origin and status of values
- Real β-factor models require reliability data and careful definitions. Values here are teaching assumptions to expose dependency, not mission-certified predictions.
- Why this operation
- The common-cause portion can defeat both units in one event and therefore scales with p rather than p². Only the independent portion receives the strong benefit of two independent failures being required.
- Substitution and calculation
- Teaching case: p=0.02 and β=0.10. Common term = 0.002. Independent term = 0.90×0.0004 = 0.00036. Total ≈0.00236, or 0.236%.
- Calculator entry
- Enter 0.10×0.02 + (1−0.10)×0.02^2.
- Mental estimate
- Ten percent of two percent is two thousandths; p² is only four ten-thousandths, so the common-cause term dominates.
- Independent check
- With β=0 the result becomes p²=0.0004. Introducing a 10% common-cause fraction raises the simplified loss probability several-fold, demonstrating the sensitivity to shared vulnerabilities.
- Physical or operational interpretation
- Duplicating hardware while leaving one shared power bus, software image or cooling loop can provide much less resilience than the equipment count suggests.
- Plain-English translation
- Two boxes are not two independent protections if the same event can disable both.
- Variation / sensitivity
- If β rises to 0.5 in the same teaching case, the common term alone becomes 1%, overwhelming the independent benefit.
- Limit / assumption
- This compact β-factor expression is not a complete fault-tree calculation and does not replace reliability engineering. It is used here to teach the consequence of shared causes.
- What this does not prove
- A low numerical Ploss does not prove the system is acceptable; failure consequence, detectability, repair time and uncertainty also matter.
- Boundary case to test
- If two units share a single upstream isolation valve that fails closed, treating their failures as independent is physically wrong no matter how reliable each unit is on a bench.
Apply the proof-gate model during multi-failure triage
Use the proof-gate sequence defined earlier while several faults are still interacting. Stabilize the life-critical function, test the proposed explanation, reconfigure one boundary at a time and preserve rollback. The purpose of this section is application under uncertainty, not a second definition of recovery gates.
Apply the workload ledger during multi-failure triage
Use the reference workload ledger above during triage: assign each new manual action to a qualified role, expose collisions between subsystems, and shed non-essential work before the same small group of experts becomes the next single point of failure.
Configuration debt is a hidden post-crisis hazard
Emergency jumpers, temporary software overrides, isolated sensors and cross-connected utilities can keep the settlement alive while making the architecture harder to understand. Maintain a live configuration map during the event. Recovery is not complete until temporary changes are either removed or deliberately accepted, documentation matches the physical system and crews know what the new normal actually is.
Exercise: one leak or two failures?
Cabin pressure is falling. At the same time, one pressure sensor disagrees with the other two and a ventilation fan trips. Do not immediately call this “three independent failures.” Preserve observations, check whether a common electrical or data fault can explain the sensor and fan, and separately test the pressure boundary. The correct fault tree begins with dependencies and evidence, not the number of alarms.

Resilience qualification lab: recover the function, then prove the configuration
Multi-failure resilience is not demonstrated when equipment starts again. A system may be running in the wrong configuration, with temporary jumpers, disabled protections, depleted reserves and operators who no longer share the same mental model. Recovery therefore has two outputs: restored function and a verified configuration that is safe to hand over.
Keep an evidence ledger during diagnosis
Separate observations from hypotheses. “Bus voltage fell at 14:32” is an observation. “Converter B failed” is a hypothesis until evidence supports it. For each hypothesis, list evidence that would support it, evidence that would contradict it and the next safe test. This reduces confirmation bias and prevents the crew from repeatedly resetting the component that happens to be easiest to access.
When failures interact, the first visible alarm may belong to the downstream victim rather than the initiating cause. A thermal alarm can follow a power failure; a communications drop can follow a shared switch fault; a low flow indication can arise from a sensor power problem rather than a pump. The diagnostic tree should follow physical dependencies.
Recovery evidence coverage
- 1 — Concrete question
- Has the recovery completed every predefined verification needed before the system is released from degraded status?
- 2 — Intuition
- Count how many mandatory recovery checks have passed out of the complete required set.
- 3 — Quantities
- Define the checklist before the crisis where possible: configuration, protective functions, performance, alarms, reserves, documentation and handover.
- 4 — Formula
- Evidence coverage equals passed mandatory checks divided by total mandatory checks.
- 5 — Read aloud
- “C evidence equals number of required checks passed divided by number of required checks total.”
- 6 — Symbols
- C is a dimensionless fraction; N terms are counts.
- 7 — Pronunciation
- The subscript identifies this as evidence coverage, not component reliability.
- 8 — Units
- Count divided by count is dimensionless.
- 9 — Convention
- Only predefined mandatory checks belong in the denominator. Do not remove a failed check from the list to make the ratio look better.
- 10 — Why division
- The ratio shows what fraction of the release evidence is complete.
- 11 — Assumptions
- Checks may have unequal importance; the ratio is a completeness indicator, not a substitute for individual pass/fail gates.
- 12 — Unit check
- 1/1 = 1.
- 13 — Numerical case
Required recovery checks: N_required,total = 20.Passed checks: N_required,passed = 17.C_evidence = 17 / 20.C_evidence = 0.85 = 85%.- 14 — Operations
- The failed and unperformed checks remain in the denominator. The system is not released simply because most checks passed.
- 15 — Algebra check
- 0.833×12≈10 passed checks.
- 16 — Mental estimate
- Ten out of twelve is five sixths, about 83%.
- 17 — Interpretation
- The recovery evidence is incomplete; the failed mandatory gate keeps the system in degraded status.
- 18 — What it does not prove
- A value of 1.0 does not prove there are no unknown hazards. It proves only that the defined checks passed.
- 19 — Sensitivity
- Adding a newly discovered mandatory check increases the denominator until it is performed. Recovery criteria should evolve when incidents reveal blind spots.
- 20 — Practice
Guided exercise. Calculate recovery evidence coverage when 17 required checks have passed out of 20.
Detailed guided correction.
- C_evidence = 17 ÷ 20 = 0.85.
- Coverage = 85%.
- The three missing/failed checks remain visible; an 85% score does not authorise recovery if any of those checks are hard gates.
Autonomous exercise. Define ten checks for recovery of a power feeder after a protection trip, identify hard gates, and show why a numerical score alone is insufficient if one hard gate fails.
Autonomous correction — open after attempting the exercise
One defensible worked solution.
- One defensible set is: fault source identified; damaged section isolated; insulation/continuity checks acceptable; protective-device settings verified; switching configuration independently checked; downstream load list confirmed; thermal/fire inspection clear; communications with affected users confirmed; controlled energisation completed; post-energisation current/voltage trend stable.
- Hard gates can include fault isolation, protective-setting verification, independent switching check and controlled energisation acceptance.
- If nine of ten checks pass, the score is 90%. But if the failed check is “fault source isolated,” the feeder remains NO-GO because the unresolved hard gate can recreate the initiating fault.
- Coverage is therefore a completeness indicator, not a substitute for gate logic.
- 21 — Mission decision
- Do not return to normal operations until every hard recovery gate passes, configuration is documented and the next shift can understand the state without oral memory.
Configuration debt survives the emergency
Temporary bypasses, manual valve positions, disabled automation and improvised cables create configuration debt. They may be justified to save the settlement, but each temporary change must have an owner, reason, expiration condition and restoration test. Otherwise the settlement can enter the next fault with hidden protections disabled.
Qualification drill
Inject a power-converter trip followed twenty minutes later by loss of a coolant pump that shares upstream power and data. Build an observation/hypothesis ledger, isolate the common dependencies and define the minimum safe reconfiguration. After function returns, create a release checklist that proves the system is not merely “working again” but is in a known, protected state.
Source context. NASA systems engineering, reliability/maintainability and operations references provide the engineering context. The evidence-coverage metric is a Delta-Sierra teaching aid, not a NASA certification rule. NASA Reliability and Maintainability Standard.
Common cause is a hypothesis that must be actively sought
When two failures occur close together, teams often assume independence because the components are different. The opposite error is to assume a common cause too quickly. Use shared dependency maps: power bus, cooling loop, software version, network switch, maintenance action, environmental exposure and supplier batch. A shared dependency that explains both observations deserves testing before two unrelated replacement actions consume spares.
Recovery energy, spares and people form one budget
Recovery consumes more than electrical energy. It uses crew attention, spare parts, clean water for flushing, diagnostic consumables and sometimes the remaining redundancy. The plan should identify which resources are irreversible or slow to replenish. A repair that restores one function by consuming the last spare for another critical function may not be the best settlement-level choice.
Fatigue changes the reliability of the recovery team
Long incidents create human common cause. The same tired crew can make correlated mistakes across otherwise independent redundant systems. Introduce shift limits, second-person verification for high-consequence configuration changes and deliberate pauses when the system is stable enough to permit them. “Work until fixed” is not a resilience strategy.
Prove the new state under load
After repair or reconfiguration, test under a representative load rather than accepting an idle indication. Observe the variables that would reveal recurrence and keep the temporary configuration visible. If the settlement cannot return to full load immediately, define a staged release with explicit limits. A controlled degraded state with evidence can be safer than an unproven rush to nominal status.
R59 recovery engineering: a restored output is not yet a restored system
After a serious failure, teams naturally want to celebrate the first return of voltage, pressure, flow or communications. That is exactly when configuration risk can be highest. Temporary jumpers, inhibited protections, bypassed sensors, borrowed spares and unusual valve lineups can make the function appear restored while reducing protection against the next event. Recovery engineering therefore has two products: restored mission function and a trustworthy configuration.
Keep three ledgers during recovery
The first ledger records evidence: observations, measurements, tests and what each one proves. The second records configuration: every breaker, software mode, bypass, valve, connector, temporary cable and replaced component that differs from the nominal state. The third records debt: deferred inspections, missing redundancy, temporary limits and follow-up actions. Mixing these ledgers into one free-form log makes it difficult to tell whether a recovered system is safe to carry normal load.
Search for common cause before replacing the obvious component
Two similar failures are not automatically independent. Shared maintenance, software, environment, power quality, contamination, manufacturing batch, procedure or operator action can defeat nominal redundancy. A recovery team should actively ask what both failed channels shared before declaring the spare channel safe. If the answer is “same update, same technician and same connector family,” the redundancy claim needs new evidence.
Recovery tests need load, duration and abort criteria
An unloaded component can pass while the integrated system still fails under current, heat, vibration or flow. Define the recovery test envelope before energisation: initial low-risk checks, controlled ramp, representative operating point, duration, parameters to trend and conditions that cause immediate abort. Where possible, compare against a known-good baseline rather than asking only whether a value stays inside a broad red line.
Rollback must remain possible
Some recovery actions are difficult to reverse. Before taking them, identify whether the current degraded state is stable and whether the proposed action could destroy evidence or remove the last working path. A good recovery sequence preserves optionality: isolate first, measure, change one variable at a time when practical, verify the consequence, and maintain a route back to the previous safe state until the new configuration has earned trust.
Qualification drill — 90% evidence, NO-GO anyway
A feeder recovery plan has ten required checks and nine pass. The missing check is independent verification that the faulted cable section is physically isolated. The numerical coverage is 90%, but the disposition is still NO-GO because the missing item is a hard gate that protects against re-energising the initiating fault. The exercise demonstrates why coverage metrics support discipline but cannot replace engineering judgement or gate logic.
Primary-source bridge. NASA’s Reliability and Maintainability standard and Systems Engineering Handbook provide the professional context for disciplined configuration, verification and reliability reasoning. The three-ledger recovery method is a Delta-Sierra educational construct. NASA — Reliability and Maintainability Standard. NASA — Systems Engineering Handbook · NASA JSC — Spaceflight Operations.
R60 resilience board: recovery evidence matters more than the number of redundant boxes
Resilience is demonstrated when the settlement can detect a failure, contain it, reconfigure around it, verify the new state and return to controlled operation without creating a worse common-cause problem. Counting redundant components is only the beginning. The operational proof is a sequence of evidence gates showing that the surviving configuration really carries the protected load and that hidden damage has not been accepted as “recovered.”
Model functional failure, not only component failure
A life-support function can be lost even when every major component is still powered: a sensor can lie, software can command the wrong state, a shared fluid can be contaminated, a connector can be mis-mated, or operators can follow an incorrect recovery procedure. Failure analysis should therefore begin with the function that must be preserved and work downward to hardware, software, interfaces, environment and human actions.
Primary-source bridge. NASA’s Reliability and Maintainability standard provides primary context for reliability, maintainability and associated engineering discipline. The settlement evidence-board method used here is a teaching implementation focused on operational recovery. NASA — Reliability and Maintainability Standard.
Common cause should be written beside every redundancy claim
For an A/B architecture, add a third line: “what can defeat both?” Shared power, software image, maintenance tool, calibration source, coolant, atmosphere, operator, physical location, fire zone and contamination pathway are common examples. This line forces the design team to confront the difference between duplicated equipment and independent capability. If the common cause is credible, the recovery plan needs either diversity, separation, a protected manual mode or a way to survive until repair.
Primary source at use. NASA-STD-8729.1 is the primary reliability and maintainability bridge already used by this course. It supports treating common-cause exposure and maintainability as evidence questions rather than assuming duplicate hardware equals independent redundancy. NASA-STD-8729.1.
Board acceptance: prove each restored function under load
At the recovery board, convert the same proof-gate model into acceptance evidence: which function was restored, under what load, for how long, with what redundancy and which temporary configuration remains. A green output alone does not close the gate.
Primary source at use. NASA’s Systems Engineering Handbook provides the verification/validation context for proving that an integrated system satisfies its intended function. R61 applies that logic to degraded-state recovery gates. NASA Systems Engineering Handbook.
Software rollback needs state compatibility
Returning to an older software build is not automatically safe if configuration files, databases, calibration values or hardware states have changed. A rollback plan should identify the software image, the compatible data/configuration set, the restore point, the test that proves correct interfaces and the path back to the newer version if the rollback fails. Resilience therefore includes configuration management, not merely a copy of old code.
Workload must recover before the mission is declared recovered
A restored output is not enough if alarms, manual monitoring and temporary procedures still saturate one specialist. Reapply the workload ledger after technical repair and keep recovery status open until recurring task load, backup coverage and handover requirements are again sustainable.
Recovery debt should be visible
Temporary jumpers, bypassed sensors, deferred inspections, cannibalised spares and reduced redundancy are forms of recovery debt. Each item needs an owner, consequence, due date and condition that would make continued operation unacceptable. A settlement that repeatedly “recovers” by consuming spares and protections can look stable while becoming progressively more brittle. The board should therefore show not only present function but how much protective depth has been spent.
Scenario exercise — the backup works, but the system is not recovered
A carbon-dioxide removal train fails. The backup train starts and measured cabin concentration stabilises. However, both trains use the same suspect sensor type, the failed train has not been isolated from a shared manifold, and the backup is being monitored manually by the only qualified technician. Declaring full recovery would be premature. The protected function is temporarily restored, but common-cause exposure, isolation uncertainty and human workload remain open. The correct state is “degraded but stable” until those evidence gates are closed.
Primary-source bridge. NASA’s Systems Engineering Handbook provides context for configuration, verification, interfaces and lifecycle control. Those disciplines are essential when a recovery changes the system from its nominal configuration. NASA — Systems Engineering Handbook.
R60 recovery drill: distinguish function restored, redundancy restored and mission restored
Use three separate status labels. “Function restored” means the protected output is available again. “Redundancy restored” means the intended backup depth is again available and verified. “Mission restored” means temporary workload, inventory consumption, deferred maintenance and operational restrictions have been cleared or deliberately accepted. These states prevent a crew from calling an event closed simply because the alarm disappeared.
During the drill, restore the function with a backup path but deliberately leave one temporary manual action in place. The team should calculate how many crew-minutes per shift that action consumes and who is qualified to perform it. If the workaround requires the same specialist who is leading repair, the human workload may set the true recovery limit before the hardware does.
Then inject an ambiguous sensor. Operators must decide whether they have enough independent evidence to trust the recovered configuration. This can include a second measurement, a material balance, power signature, physical inspection or response to a controlled test. The discipline is epistemic as much as mechanical: recovery requires knowing that the system is safe, not merely hoping that the backup is working.
