


MARS BIBLE — RISK & RESILIENCE
Martian perchlorates: exposure, cross-contamination, and clean/dirty boundaries
The problem is not only what is in the soil; it is how soil reaches airlocks, tools, filters, clothing, water, food, and crops.
NASA studies Martian perchlorates and detoxification approaches because these salts affect health, resource processing, and local production. A settlement must especially prevent outside dust from becoming chronic indoor contamination.
From regolith to human exposure
Contaminants follow a chain: regolith, suit surface, airlock, tool, glove, indoor floor, filter, hand, food, or water. Different barriers can interrupt different transfers. Robust control combines exclusion, cleaning, confinement, and measurement.
Saying “Mars has perchlorates” does not quantify human risk. Engineers need concentration, chemical form, exposure route, duration, absorbed amount, and adopted health limits. Design values should connect to measurements and be updated with actual site data.
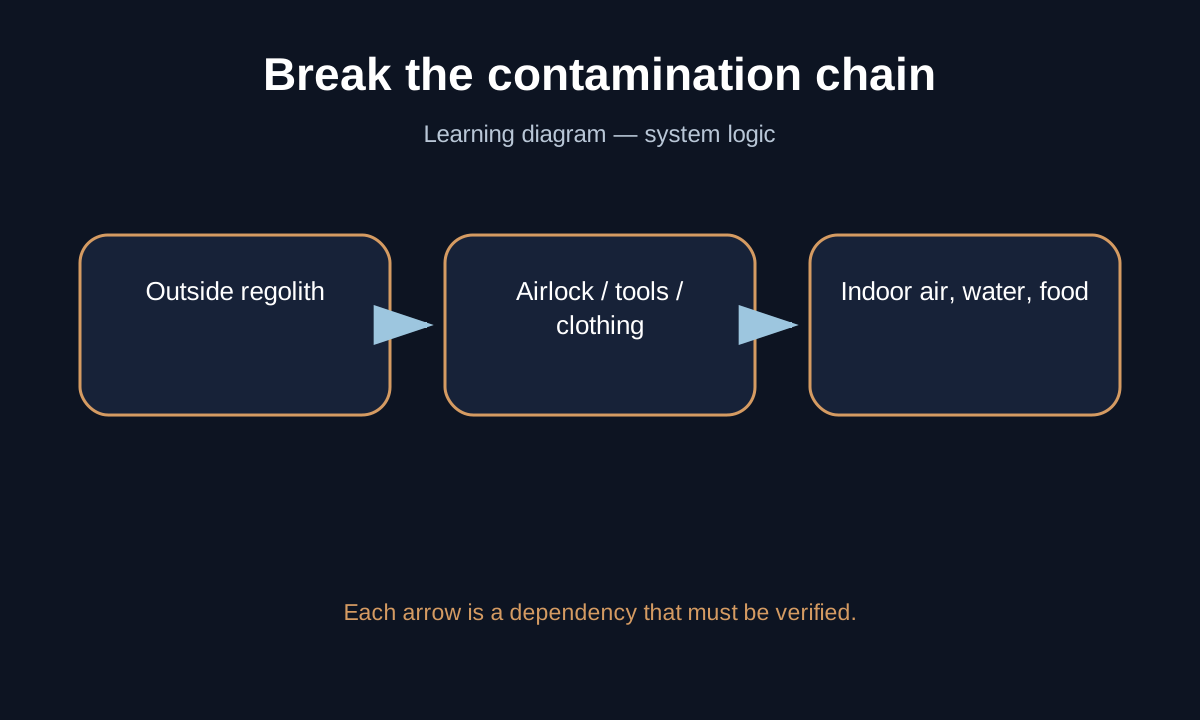
The airlock becomes a chemical boundary
Clean/dirty separation can use zones, brushing, filtered vacuuming, exterior-only equipment, suitports, or transfer procedures. Each technique has efficiency and creates contaminated waste.
Very fine dust may cross visible barriers. Surfaces and filters therefore need periodic sampling. A slow upward trend is easier to correct before contamination reaches water, kitchens, or greenhouses.
Treat soil before agriculture or clean industry
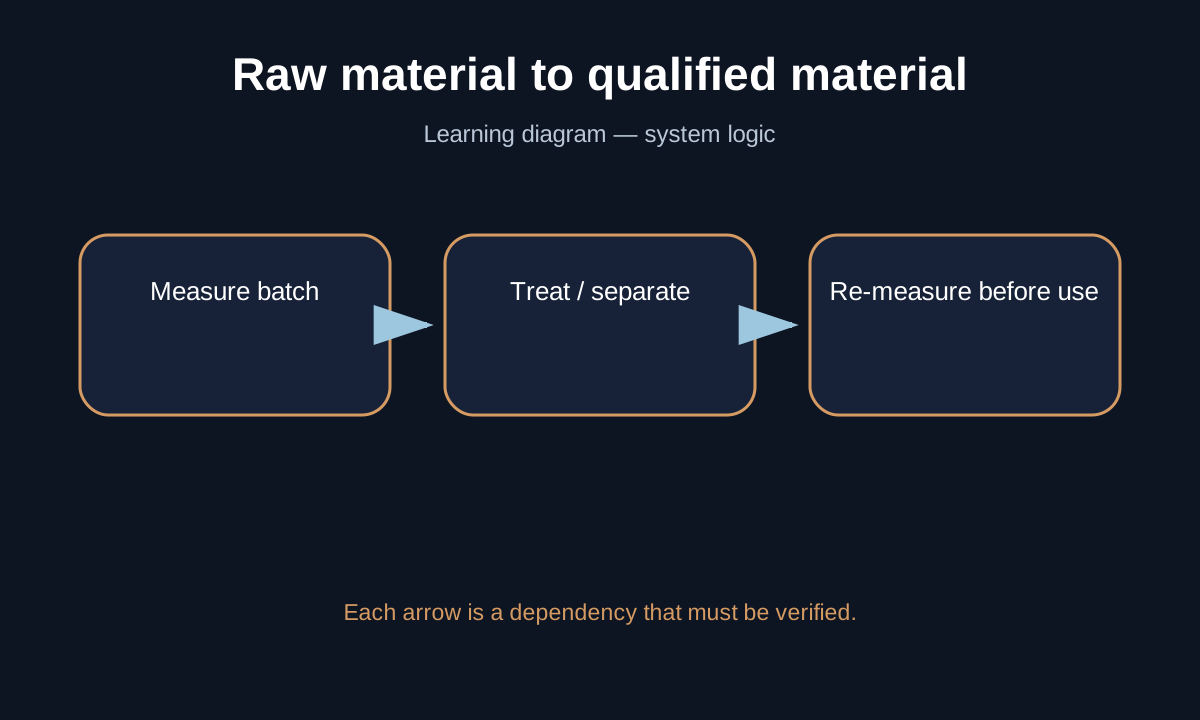
If regolith is used as feedstock or agricultural support, extraction, washing, chemical treatment, or another process may be required. Treatment must be validated against the contaminant actually measured and should not create a worse secondary waste.
Production flow should separate raw material from qualified material. A treated batch enters a greenhouse or clean workshop only after measurement demonstrates compliance with the specification.
Monitoring must distinguish environment from exposure
Finding contaminant in a filter does not automatically mean the crew received a large dose; conversely, a low average can hide a local hotspot. Sampling locations need to be representative, with personal or biological indicators where justified.
Monitoring should record trends, locations, and activities. A rise after each EVA may reveal procedural failure; a rise associated with a workshop may show ventilation carrying dust toward a clean zone.
Understand decontamination efficiency and residue
LEARNING CALCULATION — ASSUMPTIONS ARE EXPLICIT
Exercise: a process reduces a pedagogical concentration from 100 units to 8. Removed amount is 100 − 8 = 92. Fractional reduction is 92 ÷ 100 = 0.92 = 92%.
Yet 8% of the starting value remains. The next question is where those 8% are: still in material, moved into brine, captured by a filter, or chemically transformed?
This shows why “92% removal” is not itself a safety statement. Residual concentration must be compared with a specification and process waste must be managed.
Contaminated waste does not disappear
Vacuuming or washing often moves contaminants into filters, wastewater, or sludge. Those streams need storage, regeneration, or treatment; otherwise the base creates a concentrated source near inhabited areas.
Industrial autonomy must therefore include filter replacement, analytical instruments, standards, and measurement consumables. Chemical metrology becomes an important settlement function.
Decision questions specific to this hazard
- What exact pathway currently allows outside dust to reach a clean zone?
- What residual concentration is measured after treatment, and by what method?
- Where does the removed fraction go: filter, wastewater, sludge, or another waste stream?
- Which sampling points reveal slow contamination before crew exposure?
- Can measurement instruments and calibration standards be maintained or replaced locally?